
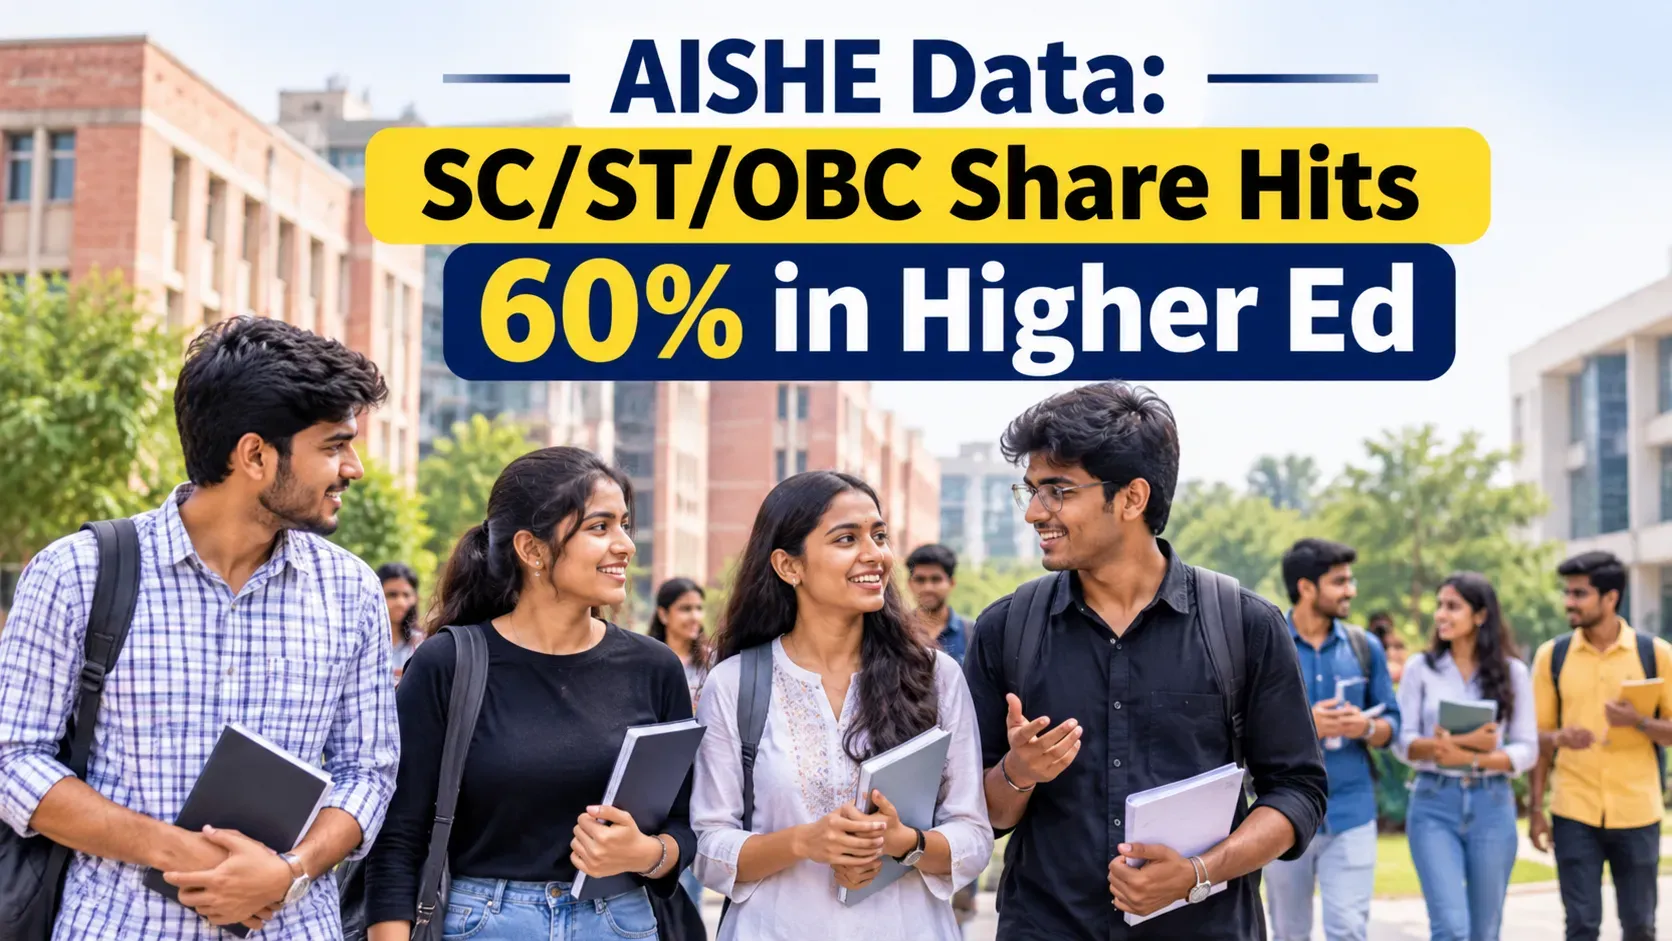
New figures drawn from the All India Survey on Higher Education have brought a clear shift into view. Students belonging to Scheduled Castes, Scheduled Tribes and Other Backward Classes now make up around 60 percent of all those enrolled in higher education across the country.
The share stands at 62.2 percent in government institutions and 60 percent in private ones, according to data for 2022-23. Overall, the combined SC, ST and OBC figure reaches about 60.8 percent. The statistics are taken from official survey returns and cover both undergraduate and postgraduate levels.
OBC students form the largest group within this total. Their share is slightly higher in private institutions at 40 percent compared with 37.3 percent in government ones. SC students account for roughly 15 to 16 percent and ST students for 5 to 8.5 percent depending on the type of institution.
The pattern is not limited to general degree programmes. Enrolment of SC, ST and OBC students has climbed steadily in several professional and advanced courses over the past decade. Their combined share has risen substantially in fields like Bachelor of Engineering, Bachelor of Technology, Master of Engineering, MBA, MBBS and MD from 2010-11 to 2023-24.
In some of these programmes the rise has been particularly sharp. Medicine and management courses show some of the largest gains. The trend appears across both government and private institutions offering these programmes.
Total higher education enrolment itself has expanded significantly during this period. Yet the composition of the student body has changed. The increasing number of students belonging to the reserved categories is a reflection of wider access through reservation policies, scholarships and increasing institutional capacity. Parents and students applying for entrance examinations tend to prefer government colleges due to their lower fees and perceived prestige. The data indicates that private institutions also now enrol large numbers of SC, ST and OBC students. Career-oriented courses that once seemed dominated by other groups have seen similar shifts.
Teachers and administrators working in both sectors encounter classrooms that look different from those of ten or fifteen years ago. The numbers suggest that efforts to broaden participation have reached deep into professional education as well.
These figures form part of the larger picture painted by successive AISHE reports. Enrolment continues to rise overall, female participation keeps growing, and representation among historically underrepresented communities remains a central feature of the system. For those planning the next stage of education, the data offers a factual snapshot of who is actually sitting in India’s college classrooms today.
Reserved Category Students Now Form Majority of Higher Education Enrolment
Palak Patel19 Nov 2026
Written by
Palak PatelEducation writer Palak Patel covers the latest education news, board exam updates, results, and career opportunities.